Visitor measurement applications, such as Google Analytics tells you how much time users spend on the website, which pages they viewed, and where they exited. But until recently, we had no idea what exactly they were doing on each page, where they were scrolling, what they were clicking on, and what they were reading. With the appearance of heat map programs, it became possible to observe the behavior of visitors down to the smallest possible detail. I present these heat map programs in my article.
What is a heatmap?
Heatmaps allow you to see how your visitors use your website. Heat maps form an overlay on your website, on which the "cold" and "warm" colors indicate where and to what extent user activity is taking place. Nowadays, heat maps form the basis of visual analytics, they show where your website visitors scroll, click and look. This information provides a solid basis for knowing how user-friendly your website is and how efficient its structure is. This gives you the opportunity to improve the user experience (UX) of your website and encourage your visitors to convert even more.
Tartalomjegyzék
- What is a heatmap?
- Advantages of using a heat map
- When should you use a heat map on your website?
- 3 methods of heat map analysis
- The best heatmap software
- Hotjar
- Crazy Egg
- Mouseflow
- Lucky Orange
- Inspectlet
- Heatmap.me
- Ptengine
- Clicktale
- SeeVolution
- Two heatmap samples from Hotjar.com
- How to set up your first heatmap with Hotjar?
- Summary
Advantages of using a heat map
Heatmaps help you understand how people interact and behave on your website, so you can get answers to critical questions that influence business decisions, e.g. "why aren't my users converting?" ;"how can I get my users to convert more?"
Using the heat map, you can determine whether your users may:
- they skimmed over important content because they don't even see it
- whether they find the essential CTAs and use them
- is their attention distracted by an element that does not help or hinders the completion of the conversion
- do all elements work the same on different devices?
Heat maps can help in making decisions based on well-founded and specific data, primarily because of the visual representation; Performing A/B tests, auditing the website's errors and weaknesses, and possibly updating or redesigning the website. Heatmaps also provide insight into the mindset of your users. How they use your website helps increase your conversions.
When should you use a heat map on your website?
The use of heat maps enables a detailed analysis of your website, but it is logical to use them primarily on the subpages that are most important in terms of traffic, usability and business goals.
1. Home page and landing pages
The homepage and landing pages are the main entry points of your website. Most users encounter these for the first time, so first impressions are very important. The heat map placed on these pages helps determine how much information users view, how they behave on the page and what elements they click on.
2. The most important pages
Top performing subpages (most viewed product page or most commented blog post) are clearly doing something right. The heat map can help you understand which elements work well and you can use the experience for your other subpages as well.
3. Underperforming pages
The worst performing pages are just as important as the best performing pages, but for the opposite reason: there's probably something wrong with them, and placing a heatmap can help you understand why visitors are ignoring these subpages.
4. New subpages
There isn't much data on your most recent pages: If you've recently added a page to your website, a heatmap is a good way to get some initial information about how the page is performing.
3 methods of heat map analysis
There are 3 methods of heat map analysis, which help to examine the performance of your website according to different aspects.
Scroll maps
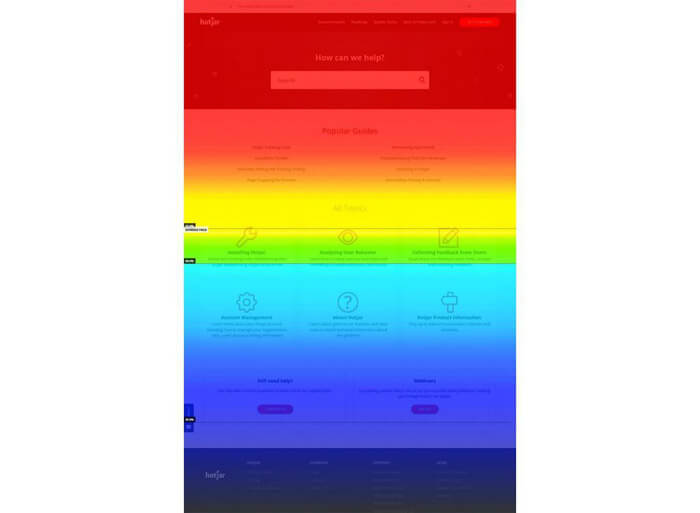
The scrolling map shows the percentage of users who scrolled to a certain point on your website.
Click maps
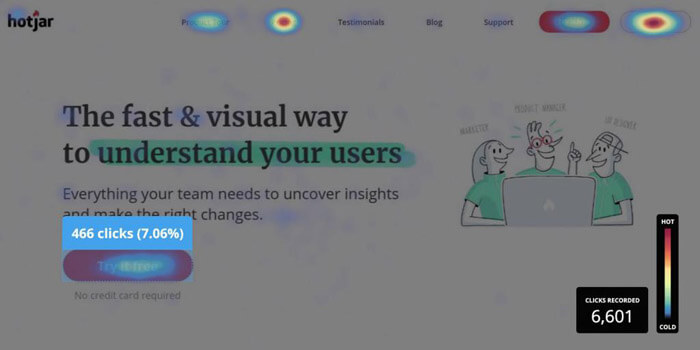
The click map shows what percentage of users clicked on the links on your website, and with the help of color codes it also shows which links were clicked by the most people out of all the clicks.
Move maps (Move maps)
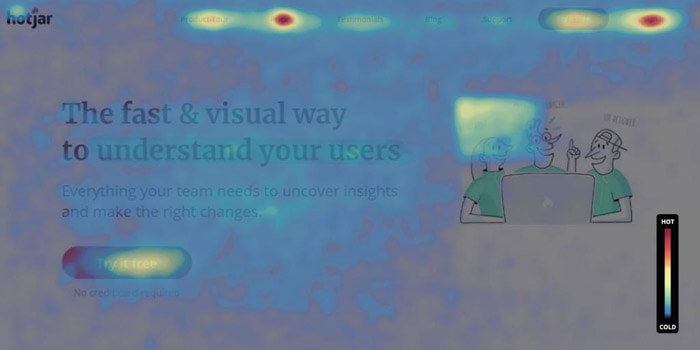
With the help of the movement map, you can track the movement of the mouse of users browsing from a desktop computer. "Hot" spots on the moving map indicate where users pause mouse movement. Several studies have shown a correlation between people's attention and mouse movement, meaning that the movement map indicates where users may have looked on your website
The best heatmap software
It is important to point out that heat map analysis is completely different from classic website analysis tools.
You can find out from Google Analytics data:
-
Where did your visitors come from?
-
Which (sub)pages were viewed
-
Which (sub)page did you move on to, within the page, etc...
Heat maps, on the other hand, reveal exactly how your visitors behaved on your site and how they reacted to each design element.
Hotjar
Website: Hotjar
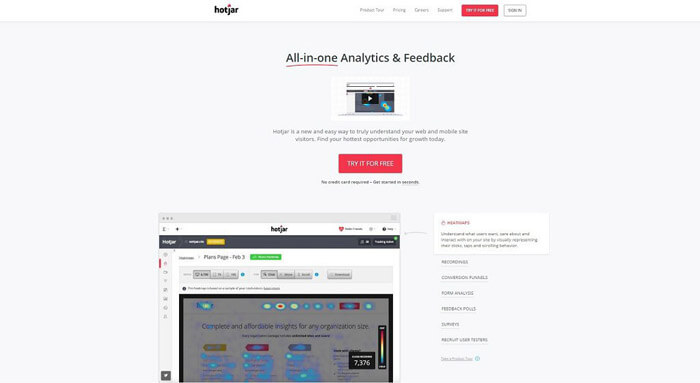
Hotjar is perhaps today's best value for money system. In terms of functionality, it is not inferior to any of its competitors, but it can be easily integrated with other systems and has a free option.
Its main functions:
-
Click heatmap
-
Mouse cursor heatmap
-
Scroll heatmap
-
Recording users
-
A/B testing
Crazy Egg
Website: Crazy Egg

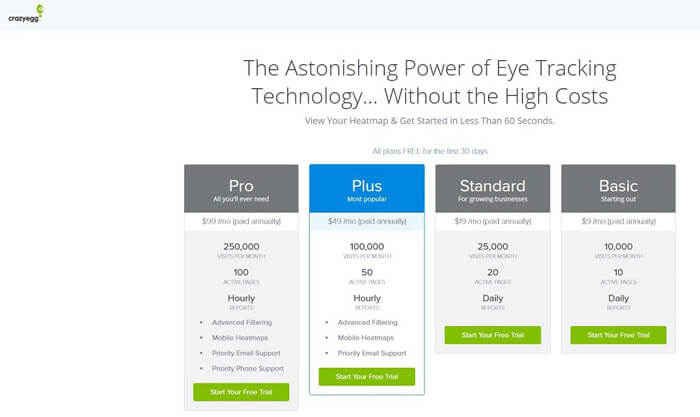
Crazy Egg is probably the most popular heatmap tool out there right now. Its main functions:
-
Click heatmap
-
Mouse cursor heatmap
-
Scroll heatmap
-
Confetti heatmap
The so-called "confetti heatmap" is a very useful function that allows us to group our heatmaps according to traffic sources. In other words, we can find out, for example, exactly how our visitors from Facebook behave on our site.
Mouseflow
Website: Mouseflow
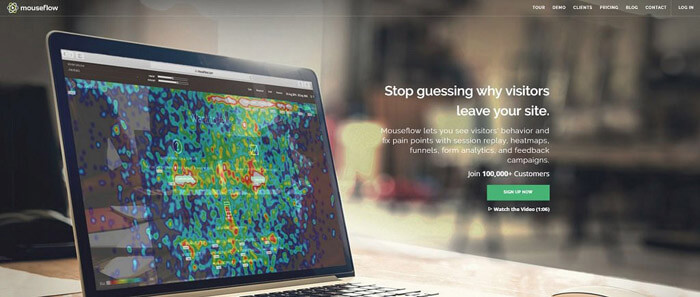
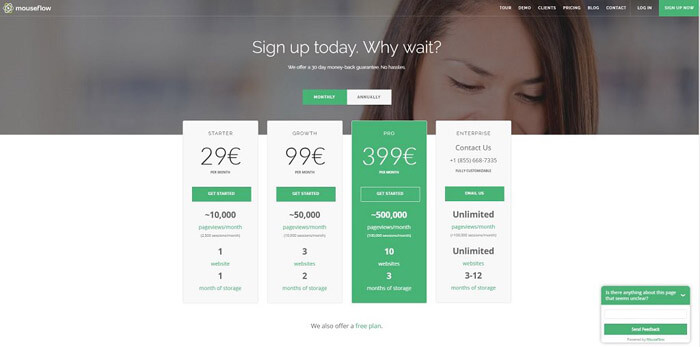
Its main functions:
-
Click heatmap
-
Scroll heatmap
It also has the ability to record user activity as a plus. In other words, it is possible to follow exactly how long and what each user does on our site, from the time they log in to the time they leave the site.
Lucky Orange
Website: Lucky Orange
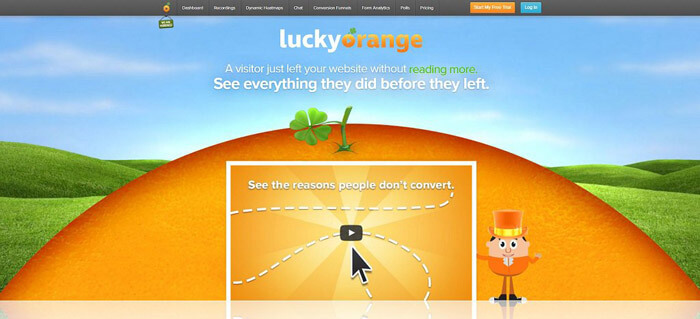
Lucky Orange combines the best features of the two devices presented above, namely:
-
Click heatmap
-
Mouse cursor heatmap
-
Scroll heatmap
-
Recording users
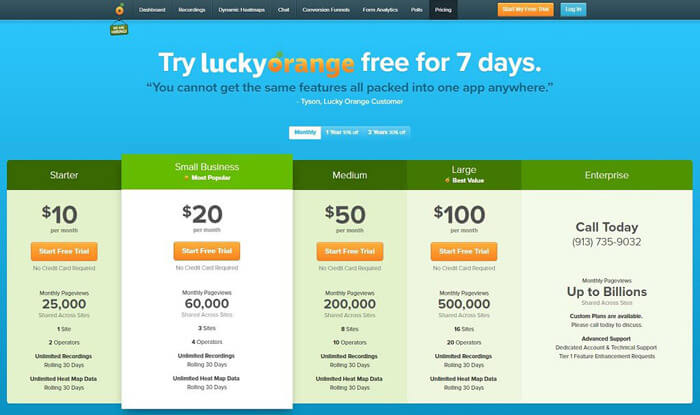
Another plus feature is that it has a live chat software that we can integrate into our website. In this way, even simpler customer service functions are triggered.
Inspectlet
Website: Inspectlet
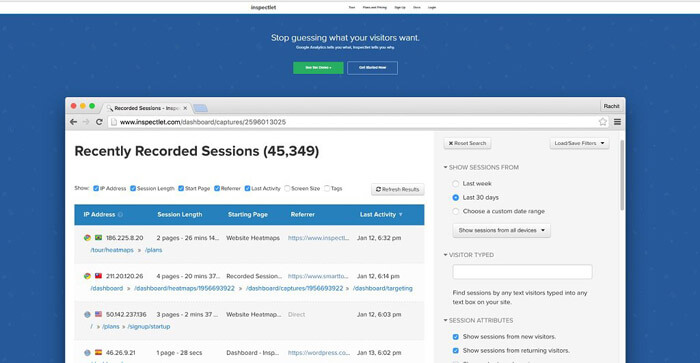
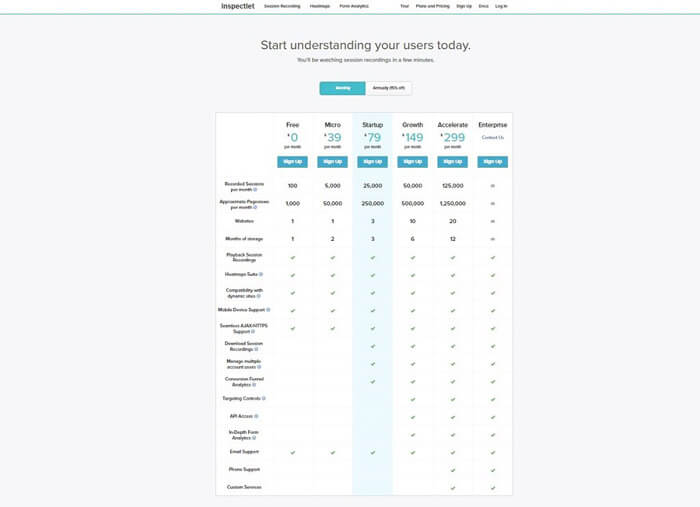
Inspectlet is already a tool that enables deeper analysis. Naturally, we have three basic heat map functions at our disposal:
-
Click heatmap
-
Mouse cursor heatmap
-
Scroll heatmap
It is also capable of recording users. What sets it apart from the others is that it creates the opportunity to mark our users, thereby giving us an idea of the behavior of our returning visitors. This function can be incredibly useful for, for example, an online store where increasing conversions is a priority. We can do this by getting to know and analyzing our users in as much detail as possible.
Heatmap.me
Website: Heatmap.me
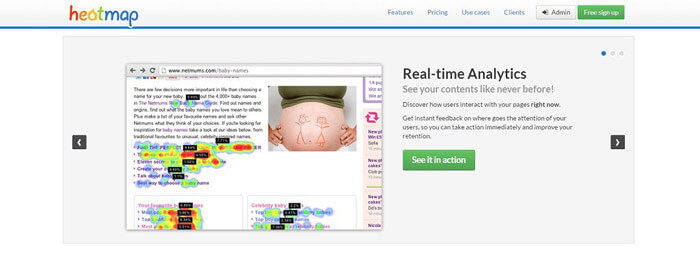
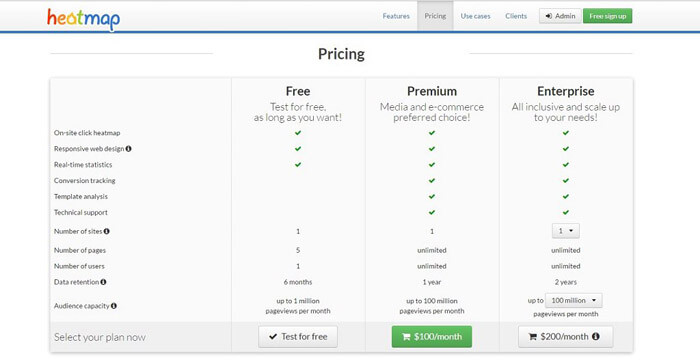
Heatmap.me's functionality is not nearly as diverse as its competitors. A huge advantage is that the "click heatmap" is free for up to 1,000,000 page downloads per month in the free version.
If you only need this function, there is no better service than Heatmap.me.
Ptengine
Website: Ptengine
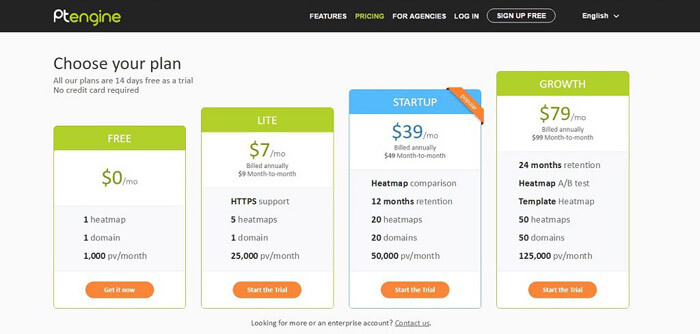
Ptengine is a combination of heatmap and web analytics software. Its main functions:
-
Click heatmap
-
Mouse cursor heatmap
-
Scroll heatmap
-
Recording users
What it has more than its competitors is that it is capable of A/B testing, that is, we can easily compare the performance of two different pages. This function can be especially useful for web designers when they want to know the reason for the existence of a minor (or major) change.
Clicktale
Website: Clicktale
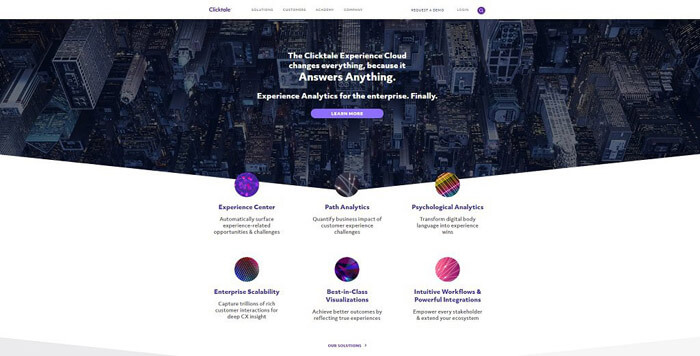
Clicktale's functionality is impressive:
-
Click heatmap
-
Mouse cursor heatmap
-
Scroll heatmap
-
Recording users
-
A/B testing
But this is not its main advantage, but that it can be integrated with almost all analytical software with a few clicks. This is a huge advantage, it saves a lot of time and energy if we work with a lot of data and visitors and analyze their behavior.
Clictale's "seriousness" is also indicated by the fact that they do not have pre-established pricing. It is their belief that every customer has unique needs, so they must tailor their services in every case.
SeeVolution
Website: SeeVolution
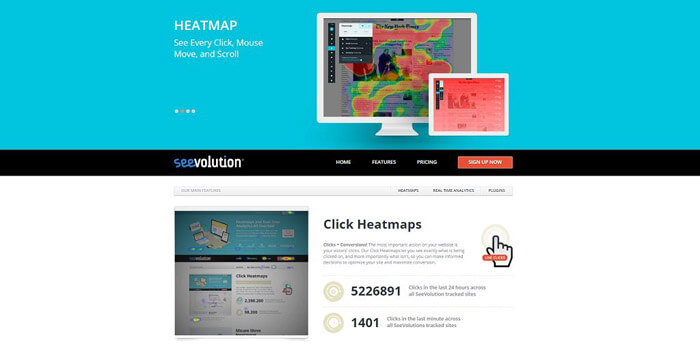
Seevolution is primarily designed for owners of Wordpress-based websites. Since it's the most popular content management system in the world, we felt obligated to mention it.
Functions:
-
Click heatmap
-
Mouse cursor heatmap
-
Scroll heatmap
-
Recording users
It does not differ much from the previous ones, its main advantage lies in its easy integration with Wordpress.
Two heatmap samples from Hotjar.com
A scrolling map shows that important content has been ignored by users
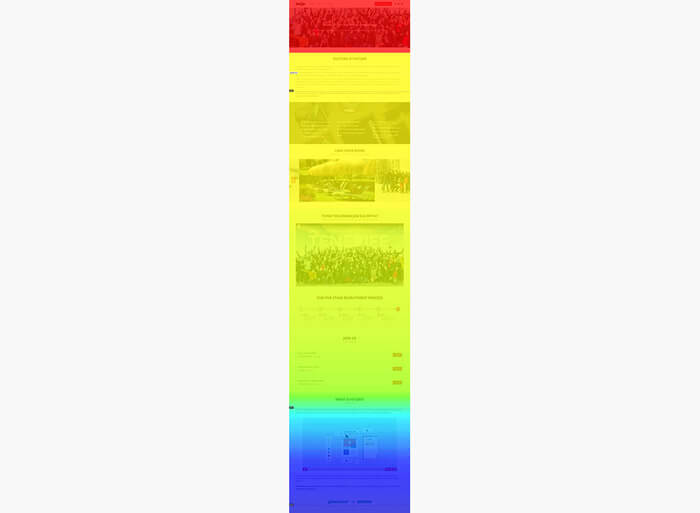
This heatmap shows how far users have scrolled down the page. Two sharp changes are immediately apparent: one at the top of the page (from red to yellow) and the second almost at the bottom of the page (from green to dark blue). On the heat map, the colors gradually become "colder", and the sharp changes indicate where the points are where a significant number of users stop scrolling.
Let's examine the green-blue change below. Based on the content, we can make two assumptions:
- visitors think this is where the page ends
- visitors convert and move on
The picture also shows that only 20% of the visitors reached the green-blue boundary line.
If we want more visitors to the bottom of the page, the best way is to indicate with an arrow at this point that the content continues.
Click map shows users ignoring a video
The heatmap shown in the image is a clickmap that shows when users click on a certain element of the page.
There was a play button on the page, but almost no one clicked on it.
The button worked perfectly, but no one clicked on it (more precisely, 3 out of 6,695 clicks). It follows from this that it is not worth placing a video on the given page, because users are not interested in it. Therefore, in order to improve the user experience (UX), this element, i.e. the video, should be removed from the page.
How to set up your first heatmap with Hotjar?
Hotjar is very easy to use and anyone can set it up on their website in a few minutes.
First, register on Hotjar.com. After registration, install Hotjar's code on your website (Don't worry, they will guide you through the entire process!) After installing and checking the code, the first heat map is available in five minutes. Here's the first step you need to take to get your first heatmap up and running:
Step 1 - Get started
To create your first Hotjar heatmap, click the "NEW HEATMAP" button.

Step 2 - Name your heatmap
Give your heatmap a name. It can be anything, but it is worth specifying the name of the page where you place it, so it will be easy to identify it later.

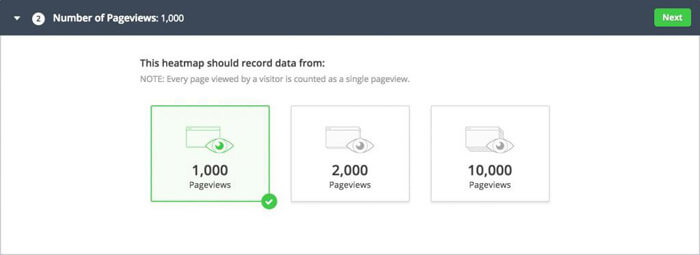
Step 3 - Enter the number of page views
Choose how many pageviews you want to record in the heatmap. (1,000 views are free!)
Step 4 - Select the target page or pages
Choose which pages you want to analyze using the heat map
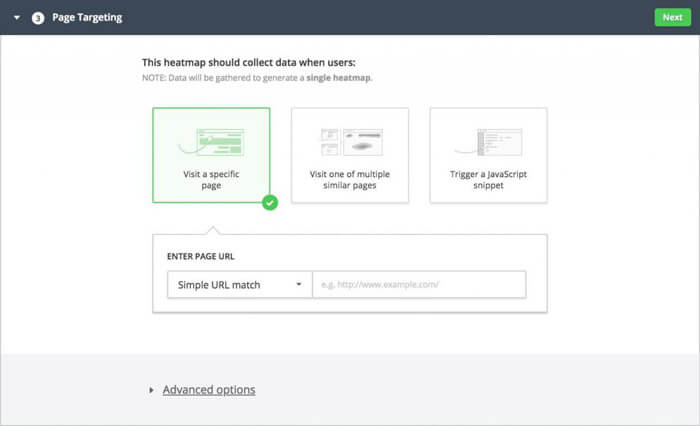
Step 5 - Deploy the heat map
Review the configuration, save it and deploy your Hotjar heatmap!

Summary
The possibilities of using heat map analysis are of concern to many website owners, but many have not yet begun to exploit its inherent potential. If we want to obtain actual information about the behavior of our visitors on our website, the use of heat maps is hardly indispensable. One of the main areas of our webshop auditing service is heat map analysis, during which it becomes clear which are the critical points where the given page performs poorly.
As a widely known fact, the human eye and brain work according to certain patterns; the way we read is also reflected in our ergonomic behavior. Our eyes first look for the essential content in the upper left corner, and then scan to the right and down. This behavior would perhaps clearly describe the webergonomic characteristics if every website consisted of a smooth, monochromatic surface. However, content, menu items, buttons, and conversion channels on a website all influence the behavior of visitors. Visitor management is especially important to achieve the best possible conversion rate; if we want to know where our visitors are scanning the website, we need to use a heat map.


